In this blog post we’ll tackle an aesthetic aspect in R & ggplot2 — namely, displaying your the labels on your axis as millions or thousands.
Assume, you have a data set with a column that has numbers ranging into the millions. To emulate this, I loaded the mtcars dataset and multiplied the disp column by a million.
library(ggplot2)
options(scipen=999)

data('mtcars')
mtcars$disp <- mtcars$disp * 1000000
ggplot(mtcars,aes(x=mpg, y=disp)) +
	geom_point()
Depending on your options, you’ll either see a very large number with many zeroes or in scientific notation.

As a matter of fact, no one wants to see those zeroes. They want to see ‘million’ or ‘M’. Using the scales library this is extremely easy to achieve.
Historically, scales provided the unit_format() function, which provided a way to set the unit and the scale. However, this function has been retired, and has been replaced with new label_ functions.
Labelling functions are designed to be used with the labels argument of ggplot2 scales.
In this example, we show the number as millions ‘M’, by providing the suffix and the scale of 1(-6). In the comments I’ve also entered the code to display the values as thousands on the Y-axis.
library(scales)
ggplot(mtcars,aes(x=mpg, y=disp)) +
	geom_point() +
	scale_y_continuous(labels = label_number(suffix = " M", scale = 1e-6)) # millions
	# scale_y_continuous(labels = label_number(suffix = " K", scale = 1e-6)) # thousands
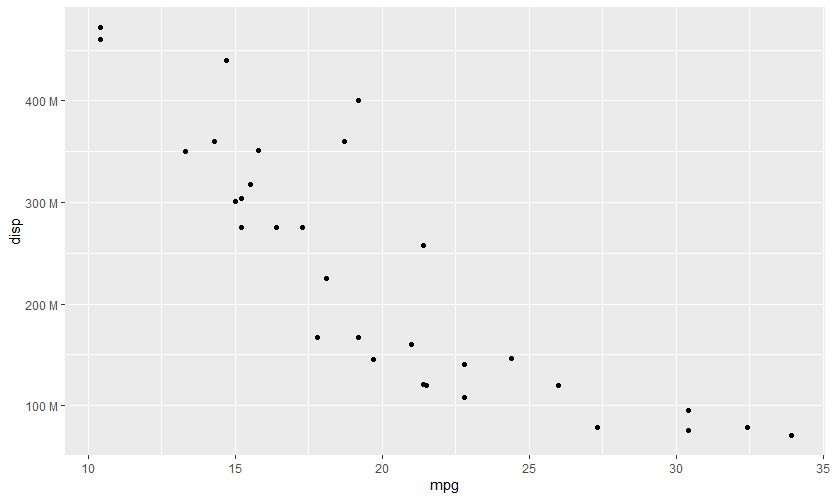
And this is the resulting chart:
By the way, if you’re having trouble understanding some of the code and concepts, I can highly recommend “An Introduction to Statistical Learning: with Applications in R”, which is the must-have data science bible. If you simply need an introduction into R, and less into the Data Science part, I can absolutely recommend this book by Richard Cotton. Hope it helps!
Great success!
There is a small typo in the commented out section.
This “# scale_y_continuous(labels = label_number(suffix = ” K”, scale = 1e-6)) # thousands”
should be scale = 1e-3 (not 6)