In this blog post, I elaborate on the functionalities of Mode Analytics, a tool that I love because of its flexibility. Mode was founded in 2013 and, this summer, raised 33 million in its Series D. Time to find out what it can do.
Many BI platforms have static database connectors or allow you to create a data source from a specific query. Mode Analytics is different. Each workspace has an SQL query editor, which allows you to create tables on the fly. These tables can then be used in the report builder or in notebooks that support both Python and R.
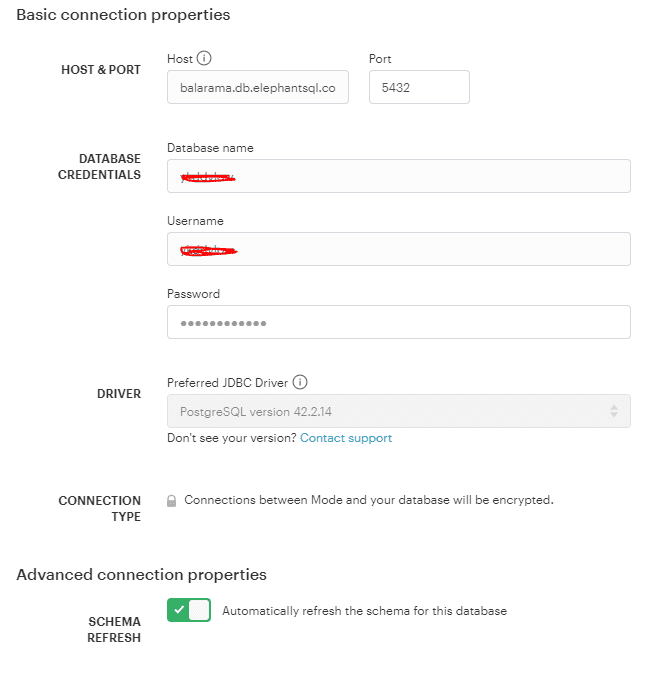
To get started, create an account at mode.com. One of the first things you’ll be asked to do is to create a database connection. In this blog post, I chose to connect to a managed PostgreSQL database by ElephantSQL that I use for storing pageview data from this blog. As you can see, setting up a connection is a piece of cake.
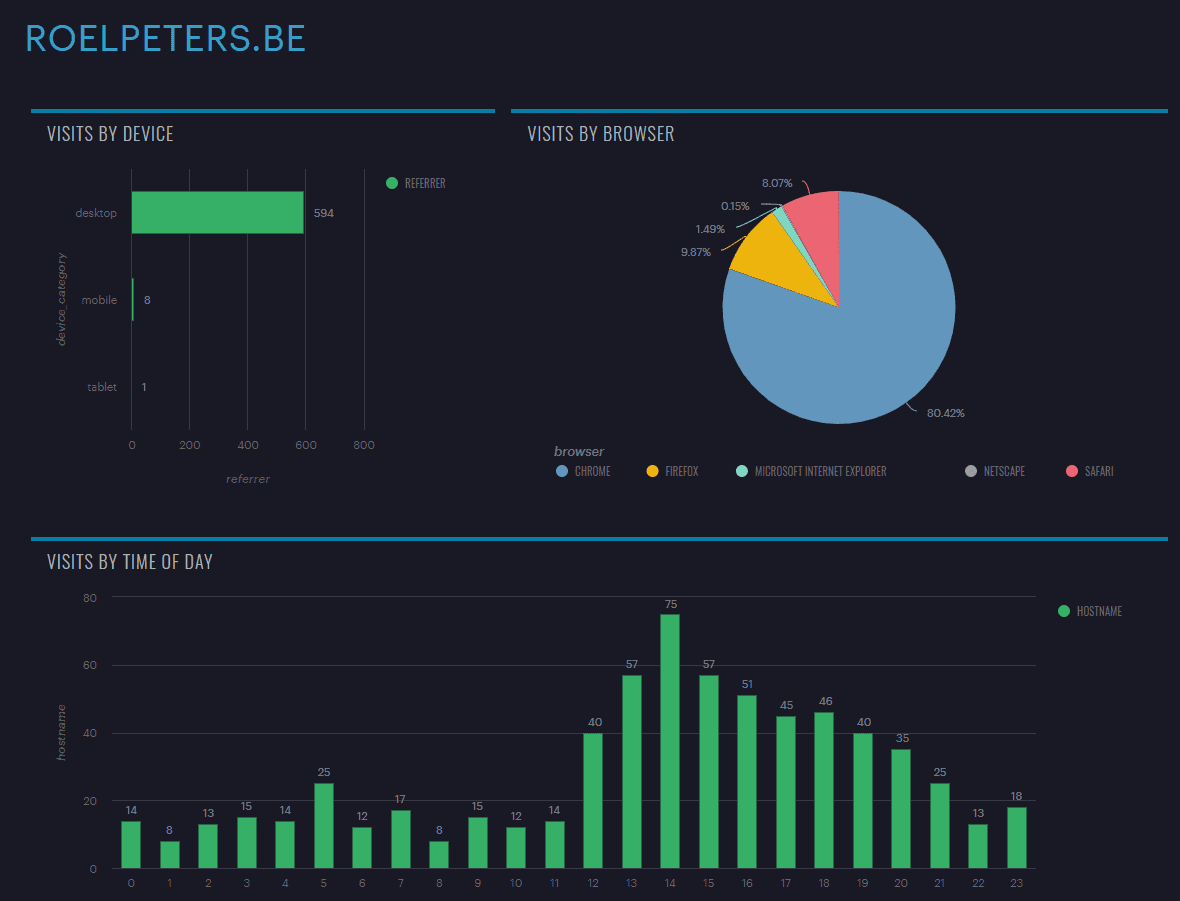
Mode’s interface is intuitive and organized. Each query is a data source for one or more visualizations. This is the true strength of Mode: your data does not need to be perfectly wrangled to be visualized properly. Instead of having millions of rows in memory, the data can be filtered and aggregated before being loaded in memory.
Query editor
Mode has fewer drag-and-drop features than other products within the same market. If you’re responsible for assessing analytics tools within an enterprise context, make sure your analysts are skilled in SQL. It is truly at the core of this BI platform.

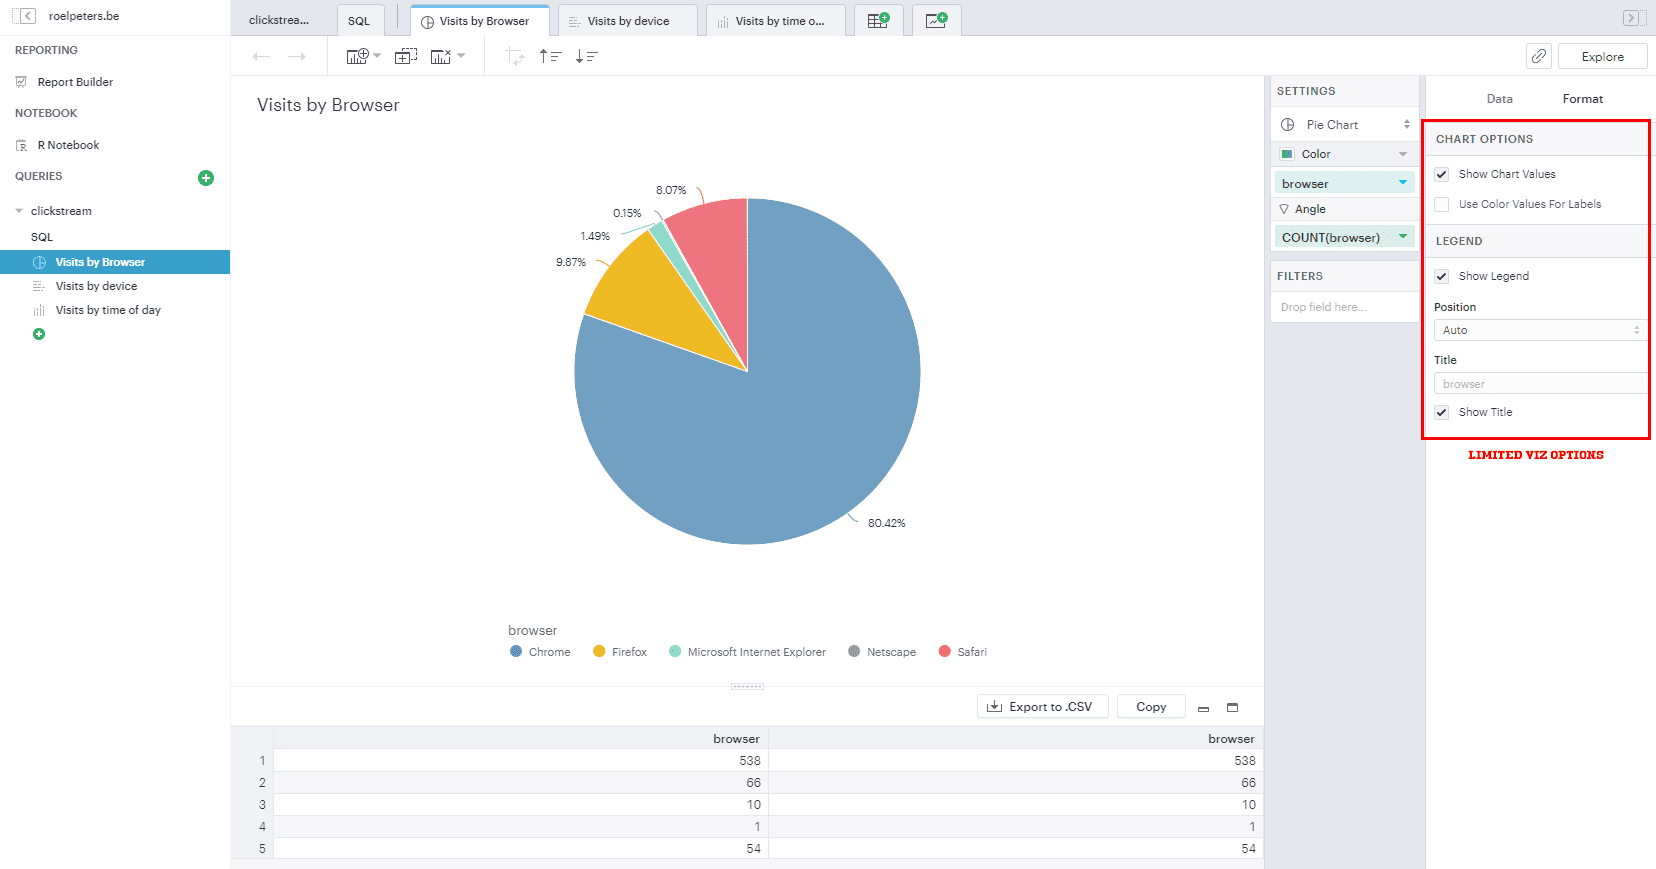
Report Builder
It’s developed with speed in mind. With the proper knowledge of SQL, one can explore and visualize data at the speed of light. However, Mode is not great for designing the pixel-perfect pie chart for an audience that’s more interested in the aesthetics than the insights.
Notebooks
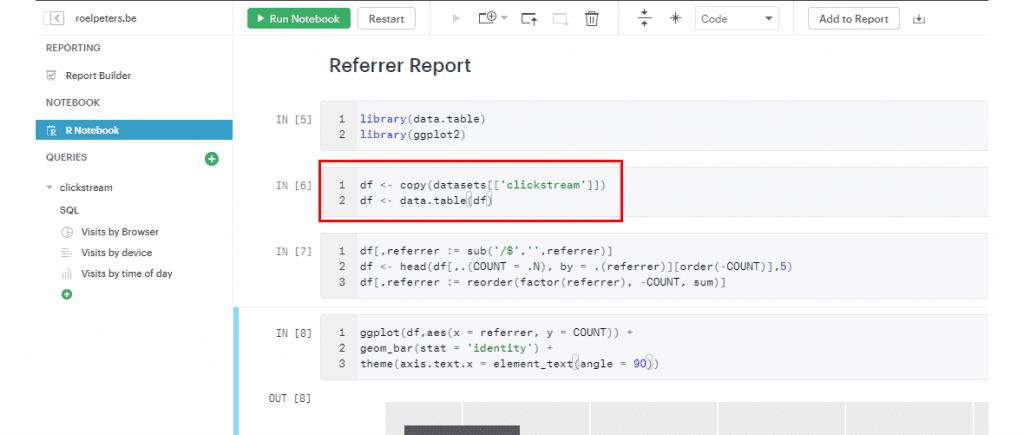
Finally, Mode supports notebooks for analysis. With the rise of the data/decision science profession, notebooks have become increasingly popular as a tool for exploratory analysis, model development, and hypothesis testing. Many BI vendors started supporting notebooks and many “notebook-as-a-service” tools have seen the light of day — e.g. count.co or Lentiq. Both R and Python notebooks are supported. Many libraries come preinstalled, but you can install other libraries within your session.
All tables, generated by your queries, are accessible through the datasets object. They can easily be migrated to a Pandas or R dataframe.
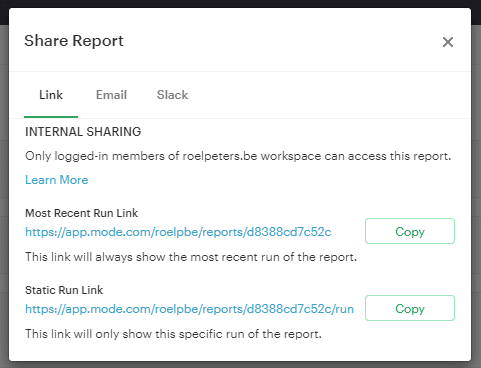
One more thing: Mode has some great sharing features. You can generate links for a specific snapshot, but you can also generate links for the same dashboard, but with the most recent data.
Your point of view caught my eye and was very interesting. Thanks. I have a question for you. https://accounts.binance.com/ru-UA/register-person?ref=W0BCQMF1