One of the most fundamental tools for evaluating classifiers is the confusion matrix. In this blog post, I elaborate on how to generate a confusion matrix in R using the tidymodels ecosystem.
First, I create a classifier to predict the income class for the very popular adult data set. From loading to preprocessing to modeling I use data.table, tidymodels and ranger.
If you’re not interested in how I got to the point of evaluating a model, and you’re only interested in producing a confusion matrix, don’t hesitate to skip it by scrolling down.
library(datasets)
library(data.table)
library(tidymodels)
library(ranger)

df <- fread('https://archive.ics.uci.edu/ml/machine-learning-databases/adult/adult.data')

colnames(df) <- c('age', 'workclass', 'fnlwgt', 'education', 'education-num', 'marital-status',
                  'occupation', 'relationship', 'race', 'sex', 'capital-gain', 'capital-loss',
                  'hours-per-week', 'native-country','y')
df$target <- 1
df[y == "<=50K"]$target <- 0
df$y <- NULL
df$target <- as.factor(df$target)

df_split <- initial_split(df)
df_train <- training(df_split)
df_test <- testing(df_split)

model <- rand_forest(trees = 100, mode = "classification") %>%
  set_engine("ranger") %>%
  fit(target ~ age + fnlwgt + `education-num` + race + sex + `capital-gain` +  `capital-loss` + `hours-per-week`, data = df_train)
What’s next? We’d like to use our model to predict the target on the test data and compare those predictions to the ground truth value, wouldn’t we?
If we want to continue using the tidyverse ecosystem, then we’re going to rely on the conf_mat function from yardstick, which is loaded by the tidymodels package. This function works as follows, you provide it:
- the data frame;
- the ground truth column;
- the prediction column
Getting the predictions and the ground truth in the same table is easy if you follow tidymodels’ guidelines. By piping the prediction with dplyr’s bind_cols, you’re making life easier for yourself, because you’ll end up with a data frame that is in the right format to feed to the conf_mat function.
In the code chunk below, we create the “pred_test” object, which is a data frame that contains all features and the predictions. Finally, we feed that object to conf_mat().
pred_test <- model %>% predict(df_test) %>% bind_cols(df_test)
conf_mat(pred_test, target, .pred_class)
And this is the result:
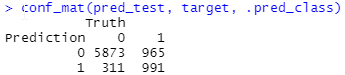
FYI: you can modify the labels (Prediction, Truth) using the dnn argument of conf_mat().
By the way, if you’re having trouble understanding some of the code and concepts, I can highly recommend “An Introduction to Statistical Learning: with Applications in R”, which is the must-have data science bible. If you simply need an introduction into R, and less into the Data Science part, I can absolutely recommend this book by Richard Cotton. Hope it helps!
Your article gave me a lot of inspiration, I hope you can explain your point of view in more detail, because I have some doubts, thank you.
Your point of view caught my eye and was very interesting. Thanks. I have a question for you.
Thank you very much for sharing, I learned a lot from your article. Very cool. Thanks.