One of the most frequent operations I have to do in a data wrangling process is changing my values or frequencies to shares, relative to the group they are in. In this blog post, I want to elaborate on doing this in d(t)plyr, one of the most popular packages within tidyverse.
Apparently, I was not the only one who had a counterintuitive gut-feeling when trying this particular operation. Nevertheless, the solution is pretty simple, once you know why it works.
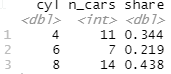
Relative frequency of one group within total
Let’s consider getting the share of cars per cylinder in the mtcars dataset. It can easily be done as follows:
library(dplyr)
data(mtcars)
df <- as_tibble(mtcars)

df %>%
  group_by(cyl) %>%
  summarise(n_cars = n()) %>%
  mutate(share = n_cars / sum(n_cars))
Returns the following:
You will also receive a warning that goes as follows:
`summarise()` ungrouping output (override with `.groups` argument)From the above example, it returns the share of each group within the total dataset. That makes sense, although the warning doesn’t.
Relative frequency of a group within higher-level group
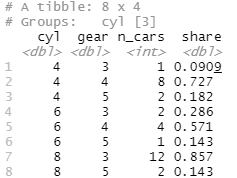
The real wtf?-moment came when I found out the following generates the share of each lowest-level group within the higher-level group, instead of calculating the share of each combined group.
df %>%
  group_by(cyl, gear) %>%
  summarise(n_cars = n()) %>%
  mutate(share = n_cars / sum(n_cars))
This returns:
And once again, a warning message:
`summarise()` regrouping output by 'cyl' (override with `.groups` argument)To find out what’s going one, we have to consult a blog post from Hadley Wickham, written last year, in the year 2020.
That’s because
Hadley Wickham, dplyr 1.0.0: last minute additionssummarise()always peels off the last group, based on the logic that this group now occupies a single row so there’s no point grouping by it. This behaviour made perfect sense to me at the time I implemented it, but it’s been a long standing source of confusion among dplyr users (and it doesn’t make sense if your summary returns multiple rows).
Relative frequency of a combined group within total
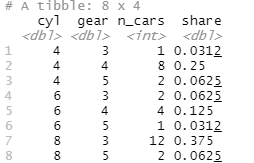
If you would like to treat each line as its own group, you can use the .groups argument within the summarise function. That’s what the warning messages are trying to tell us.
df %>%
  group_by(cyl, gear) %>%
  summarise(n_cars = n(),  .groups = 'drop') %>%
  mutate(share = n_cars / sum(n_cars))
This returns:
The .groups argument accepts multiple arguments:
- drop_last: default behavior
- drop: removes the various grouping levels
- rowwise: every row becomes a group, the share will always be 1 if you calculate it because the nominator and denominator are on the same level.
- keep: preserves the grouping of the input, differs from row-wise if your summary returns multiple rows
Your point of view caught my eye and was very interesting. Thanks. I have a question for you. https://www.binance.info/sv/join?ref=OMM3XK51