When you have a scatter plot in Tableau, you often want to add a trend line to indicate a relationship between two variables. However, sometimes it appears that it’s impossible: it’s greyed out and there is a tooltip that says “trend lines are not supported when marks are stacked”. Let’s solve that.
Let’s say you have a beautiful scatter plot and you want to add a trend line. From the Model section within the Analytics tab, it should be one drag and drop away. However: a greyed oud “Trend Line”. How to solve this?
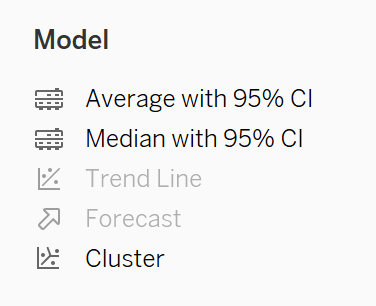
What’s causing this? You have Stack Marks enabled. When you have dots in your scatter plot, of multiple categories (represented by color or shape), you theoretically could stack these. But it doesn’t make much sense. It’s more a feature for bar or area charts.
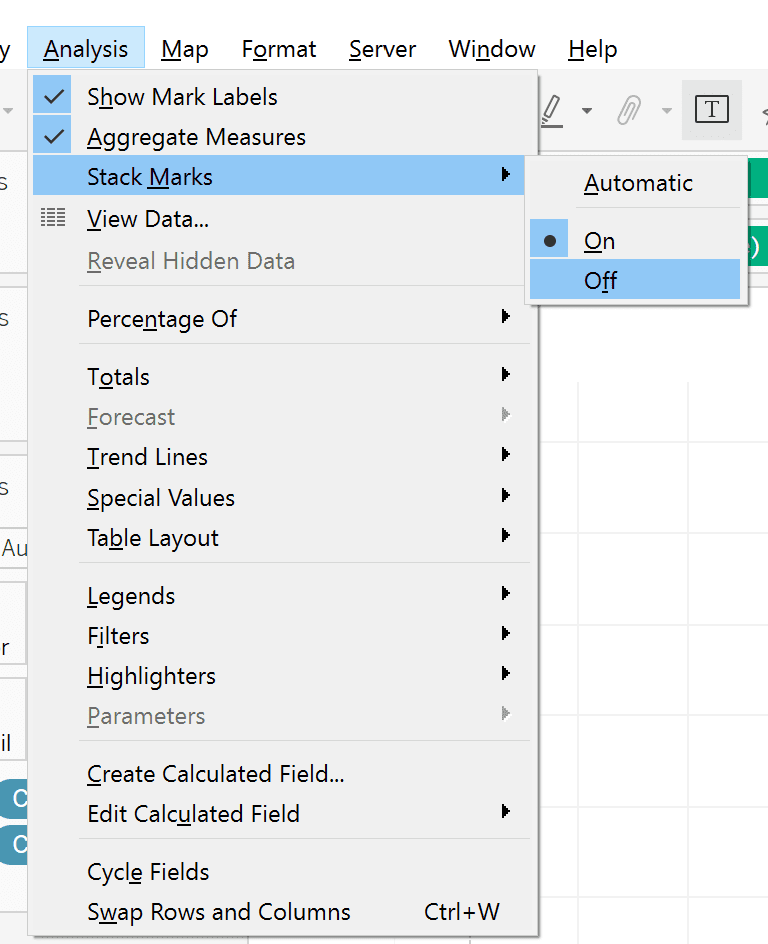
By turning Stack Marks off, you will enable adding trendlines.
Great success!
Your article helped me a lot, is there any more related content? Thanks! https://www.binance.com/bg/register?ref=P9L9FQKY
Thank you for your sharing. I am worried that I lack creative ideas. It is your article that makes me full of hope. Thank you. But, I have a question, can you help me? https://www.binance.com/cs/join?ref=OMM3XK51