The recent crypto bull market got me interested in chartist approaches to trading strategies. I’ve always wanted to use Deepnote‘s notebook solution, so I decided to combine my newfound hobby of algorithmic trading with my new tool craving. I started using Backtrader in Deepnote, but that produced some plotting issues.
Basically, when you use the plot method on a Cerebro object in a Notebook, some unexpected things will present themselves.
If you use plot, without or without the iplot argument set to True, you’ll run into this error:
'NoneType' object has no attribute '_send_event'Furthermore, IPython will render the Javascript object simply as the following text lines.
<IPython.core.display.Javascript object>[[<Figure size 432x288 with 10 Axes>]]What you can do to produce an interpretable visualization in your notebook is the following:
- Use matplotlib magic to set the rendering engine to ‘inline‘
- Set matplotlib’s rcParams to something readable
- Set the plot method’s iplot argument to False
%matplotlib inline
cerebro = bt.Cerebro()
cerebro.broker.setcash(10000.0)

cerebro.addstrategy(YourStrategy)
cerebro.adddata(bt.feeds.PandasData(dataname = df))
cerebro.run()

plt.rcParams['figure.figsize'] = [15, 12]
plt.rcParams.update({'font.size': 12})
cerebro.plot(iplot = False)
This should produce something readable, yet not interactive, like this (cropped).
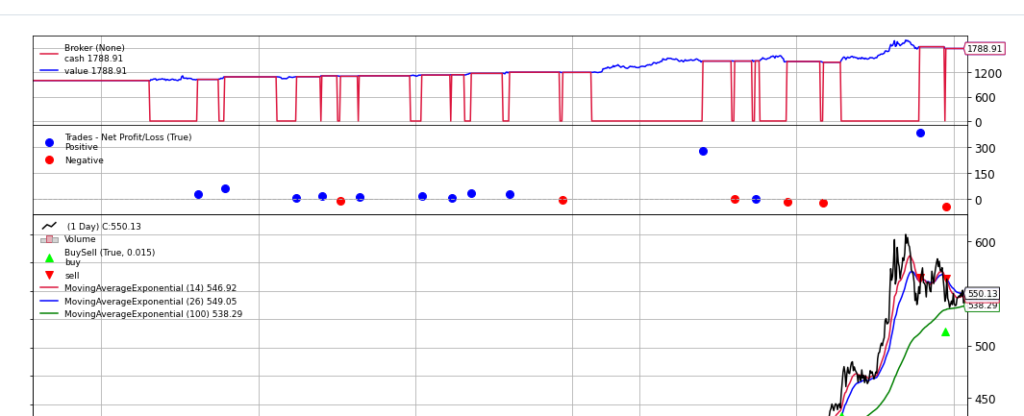
Great success!
Awesome. Worked for me in a jupyter notebook opened in vscode. Thanks.
Thank you for your sharing. I am worried that I lack creative ideas. It is your article that makes me full of hope. Thank you. But, I have a question, can you help me?