Me and my fellow (post-)millennials are branded as lazy and narcistic, staring at the blue light of our devices all day. But has anyone considered we entered a job market that was in shambles, have to fear the rise of the robots, and push around bullshit just to get around? Furthermore, it seems selling our organs is the only plausible way to afford renting a house. And once you think you’re ready to buy a house, reality hits you with blunt axe in the face. This is the story of Ghent-rification: or how Ghent traded affordable housing for perfect coffee and Malbec wine.
According to Lonely Planet, Ghent is Belgium’s best kept secret. It is a popular university city with some picturesque medieval scenery, countless bars, a castle, quiet rivers and one of the largest city festivals in the world. Under the liberal-social-democratic(-green) local government, the city shed it’s post-industrial looks and became a popular destination for both Belgian and international tourists. The city pioneered pedestrian zones and the complete city center has now been car-free for over a year. Its University is now in the top 100 universities of the world and its mayor almost became best mayor of the world.
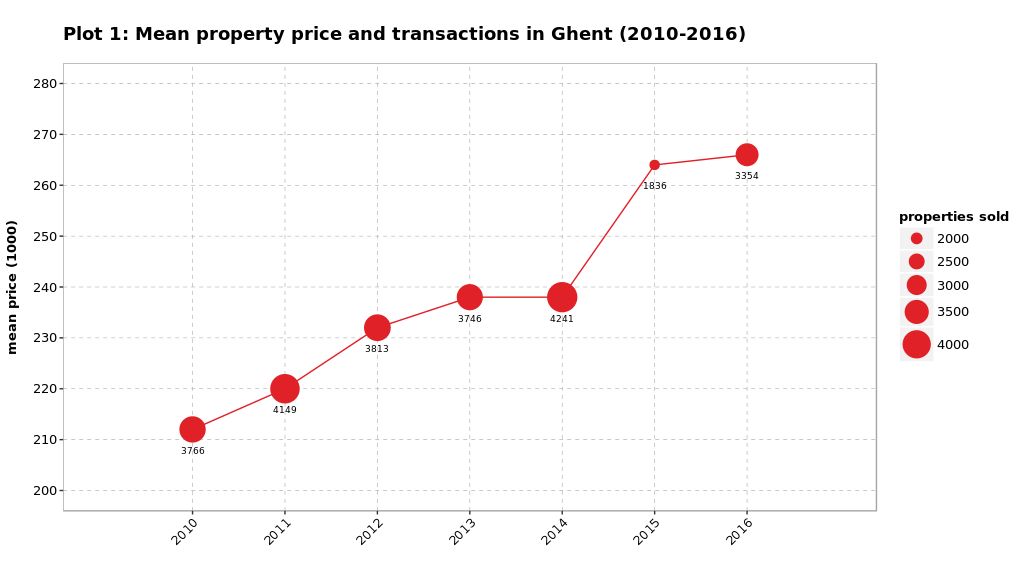
But for many, living inside the city has become out of reach as property prices dance to the drum of gentrification. Local merchants and dark pubs are making way for coffee bars, wineries and the ‘holy food market‘. Cheap flats and old houses are being renovated and sold again on the market. To sum up: the transformation of the city has had a huge impact on housing prices1. Between 2010 and 2016 the mean price of properties (excluding land) sold in the city rose from 210.000 euro to 265.000 euro 2.
Strikingly, prices of flats are more or less the same as house prices. Both have seen their prices rise from 200.000 to more than 250.000. One explanation that mean prices for flats are the same as mean prices for houses is that flats are mostly found in the city center while houses are mainly found in the periphery. At first glance, it appears that mansion (villa’s, land houses and bungalows) prices appear to be more stable over time.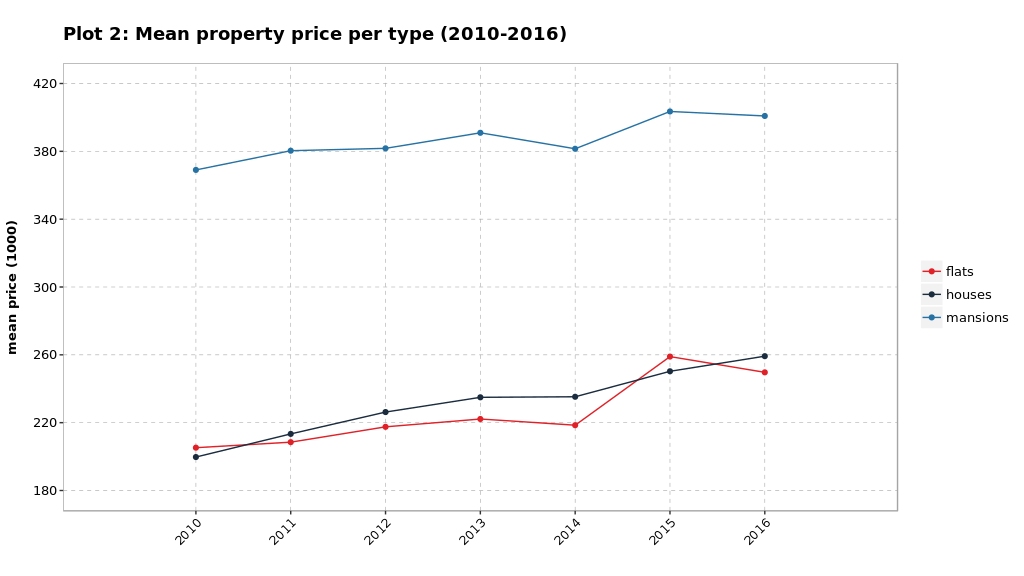
When we compare this to other Belgian cities, we can see that these changes are largely in line with Brussels and Antwerp. Both Luik and Charleroi have seen a larger price increase for mansions (compared to flats and houses). A plausible explanation is that both cities are in Wallonia, have larger suburbs and more bungalows. We can also divide each market into segments. p103 is the segment of the 10% cheapest properties sold while p90 is the segment of the 10% most expensive properties sold. As you can see, in all markets there is a ‘long tail’ on the right. Which mean that the mean transaction price is strongly influenced by expensive flats, houses and mansions. Particularly mansions have a very long tail as they contain the most luxurious modes of living. In absolute terms, the most expensive segments have seen the largest price increases, for all property types.
 But when we evaluate relative price changes, we get a completely different picture. Which brings us to the central issue. All property types and all segments have seen a price increase over between 2010 and 2016. However, both for houses and flats, it is the cheapest segments that have seen the largest price changes. For cheap flats, the price peaked in 2015 with a price increase of 60% in five years time. If you graduated in Ghent and gotten attached to city life, and want to move here permanently one day, start saving early.
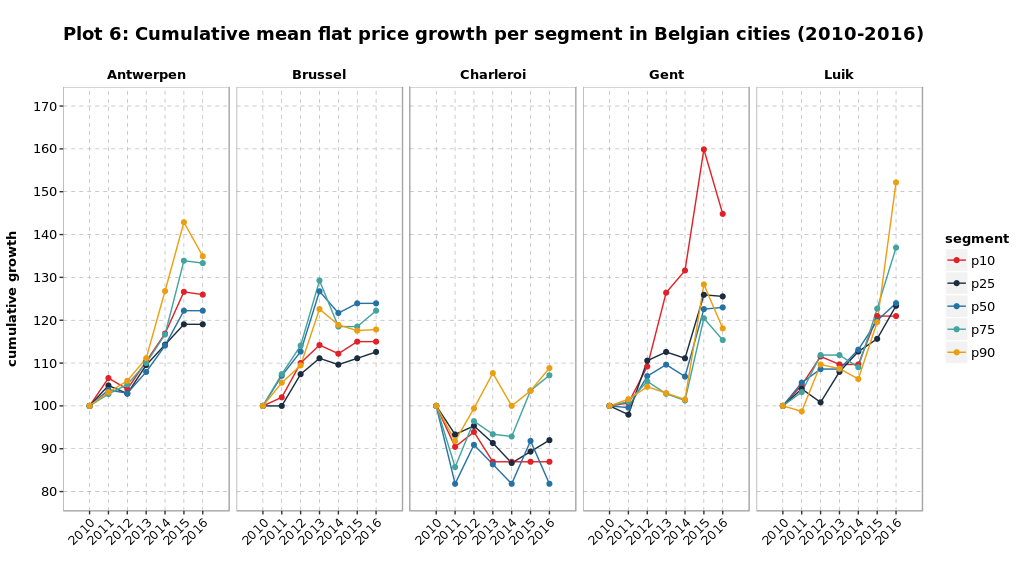
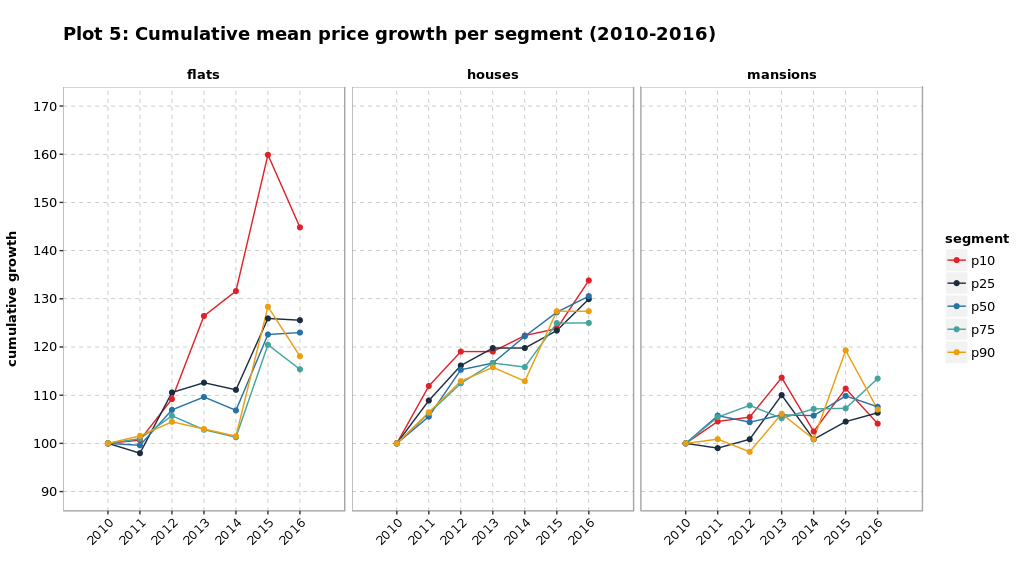 When we compare this to a selection of other Belgian cities, we can see that this is specifically a problem of Ghent. In other cities, in the Dutch-speaking Flanders, the French-speaking Wallonia and in bilingual Brussels, it’s mostly the top segment of the market that has experienced the largest price increases. A plausible explanation for Ghent’s price explosion in the bottom segment is that its university has seen its enrollment numbers increase drastically, from 32.000 in 2010 to 41.000 in 2017. Many of these students move to the city and need a place to live. They mostly put pressure on cheap housing possibilities.
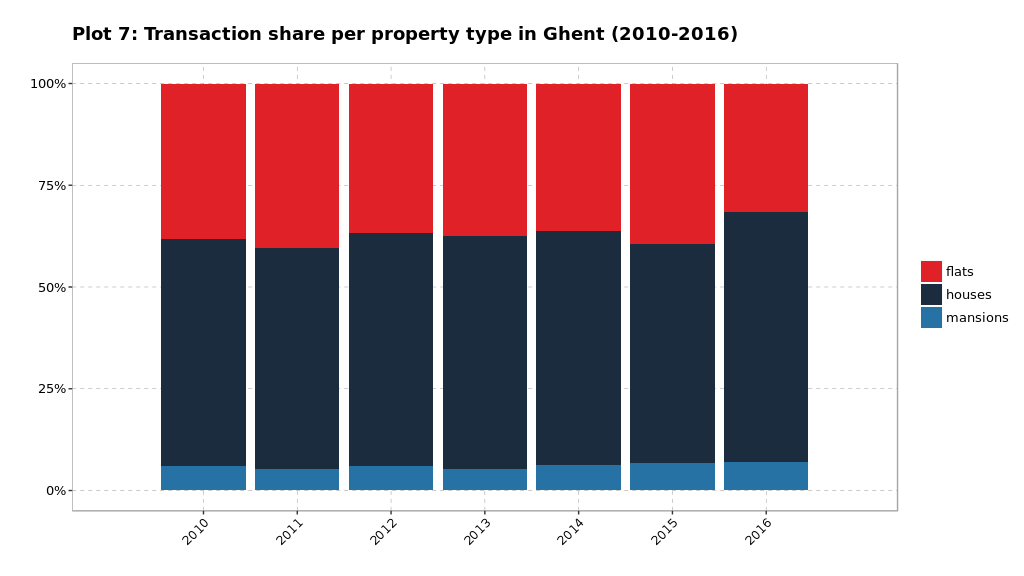
 It’s probably to early to talk of a trend, but it seems like the share of houses sold is slightly increasing and the share of flats sold is decreasing. Maybe the stock of houses is increasing while the stock of flats is decreasing, maybe flats are being rented out more and change hands slower?
 In the map below we plotted the price increase (for houses) between 2010 and 2016 for all municipalities that had more than 25 transactions both in 2010 and 2016. It appears that the heaviest price hikes are in the top left corner of the maps; in the province of East- and West-Flanders, where also Ghent is located. For its citizens that are looking to buy a house, somewhere in the vicinity of their beloved city, it truly must appear that housing prices are rapidly rising and the only way to escape it is to move to the other side of the country.
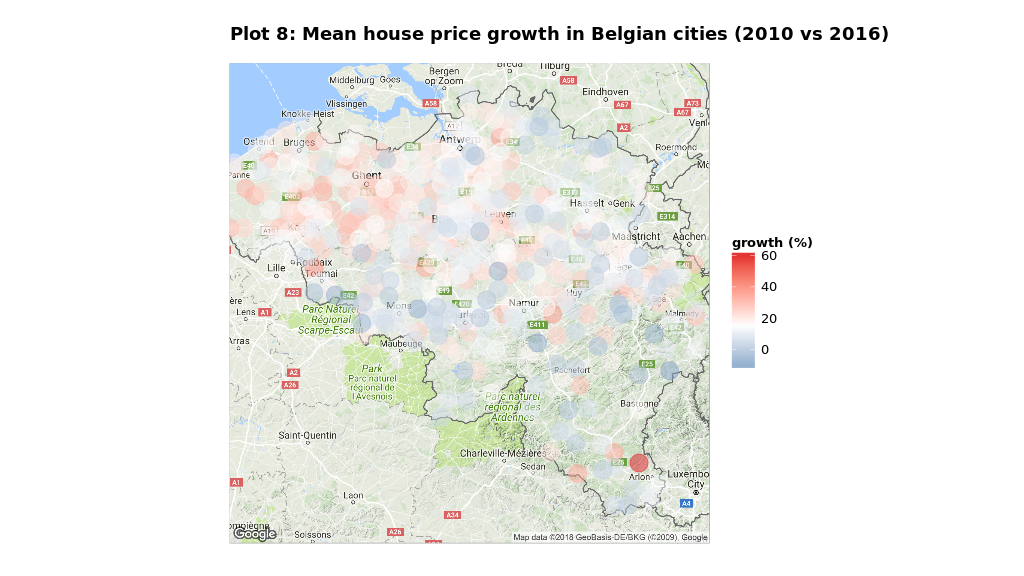 On a macro scale, we can identify a tragedy in the making. Larger cities mostly have a higher unemployment rate, leaving people behind with a replacement income such as unemployment benefits, yet they also have the highest housing prices.
To conclude: G(h)entrification is not solely a problem of Ghent. Many cities in Europe (and around the world) have seen severe price hikes over the past decades. Coffee and wine bars, Deliveroo kebab, book clubs, personal trainers and high rents are the new urban standard. However, Ghent has seen alarming price increases in flats, perhaps related to the growing influx of students. Because flats are on average cheaper than houses, this issue is mainly troublesome for low-income (one-member) families. The question is how a progressive government has let it come so far over the past 20 years. But maybe more important, how will the next legislation tackle this issue?
- Numbers by Statbel. All prices are nominal. ↩
- The amount of transactions exploded in 2014 because of the modification of housing subsidies in 2015. ↩
- If you’re unfamiliar with percentiles, just imagine this. You get the price of p10 when you rank all transactions in a year from low to high and stop counting when you counted 10% of all transactions. Then you take a look at the price of the transaction where you stopped counting. Similarly, you can get the price of p90 when you rank all transactions again and stop counting when you counted 90% of all transactions. ↩