
In this blog post, we’ll make a treemap in Python using Plotly Express. While this seems like a trivial task, there are some intricacies involved. I ran into multiple error, and I want to make sure you don’t.
First, let’s load all relevant packages that you’re gonna need throughout this tutorial.
import plotly.express as px
import pandas as pd
import numpy as np
The video game sales data set has the right topology for a treemap data set. Although it’s hosted on Kaggle, I pull it from a GitHub repo in the code chunk below. There’s some rough cleaning involved:
- Drop rows with NAs
- Set the year to dtype ‘int’ — it was set to float because it contained NAs
- Group by platform, genre and year and summing the EU Sales
- Add a percentage change column
- Reset the index
- Only keep the year 2010 (arbitrary choice)
- Overwrite Pct_change growth of over 100%, by setting it to 100% (otherwise your colors won’t make sense, later on)
The columns we’re left with will be used in the treemap chart.
df = pd.read_csv('https://gist.githubusercontent.com/zhonglism/f146a9423e2c975de8d03c26451f841e/raw/f79e190df4225caed58bf360d8e20a9fa872b4ac/vgsales.csv')
df = df.dropna()
df['Year'] = df['Year'].astype('int')
df = df \
	.sort_values(['Platform', 'Genre', 'Year']) \
	.groupby(['Platform', 'Genre', 'Year']) \
	.agg({'EU_Sales': 'sum'})
df['Pct_change'] = df.pct_change()
df.reset_index(inplace = True)
df = df[df['Year'] == 2010]
df.loc[df['Pct_change'] > 1, 'Pct_change'] = 1
Next, we remove the rows that have a value of zero. We do this because otherwise, you’ll run into an error (see below). It’s caused by Plotly’s mechanism to determine each category’s color, which is recursively determined by the average value of its subcategories. It uses np.average with weights, which has the requirement that its weights shouldn’t sum to zero.
ZeroDivisionError: Weights sum to zero, can’t be normalized
df = df[df['EU_Sales'] > 0]
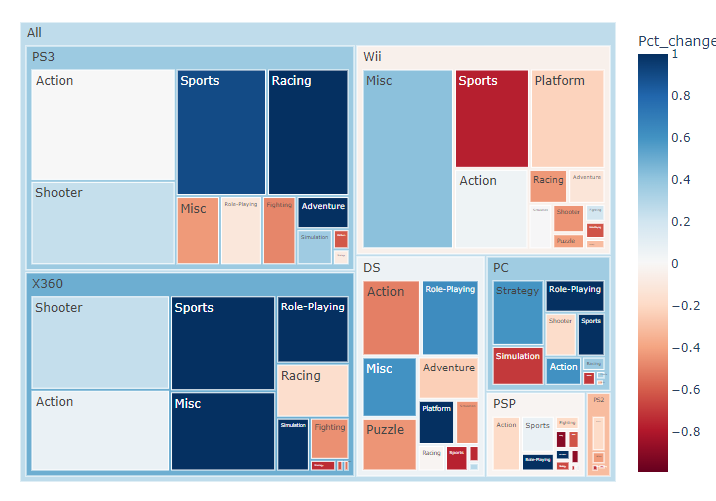
Finally, we can render the treemap using Plotly Express. Although it’s not strictly necessary, I’ve added an extra variable to the list that is passed to the path parameter. That’s because a treemap’s rectangles need to add up to 100%, which is described as a constant named ‘All’.
fig = px.treemap(df,
    path = [px.Constant('All'), 'Platform', 'Genre'],
    values = 'EU_Sales',
    color = 'Pct_change',
    color_continuous_scale = 'RdBu',
    width = 800,
    height = 600)
fig.show()
Take note, to use the path parameter in the treemap function, and to add a Constant, you need a recent version of Plotly. Otherwise you’ll run into the following errors:
Error related to the path parameter:
treemap() got an unexpected keyword argument ‘path’ in plotly.express
Error related to the Constant:
AttributeError: module ‘plotly.express’ has no attribute ‘Constant’